The problem
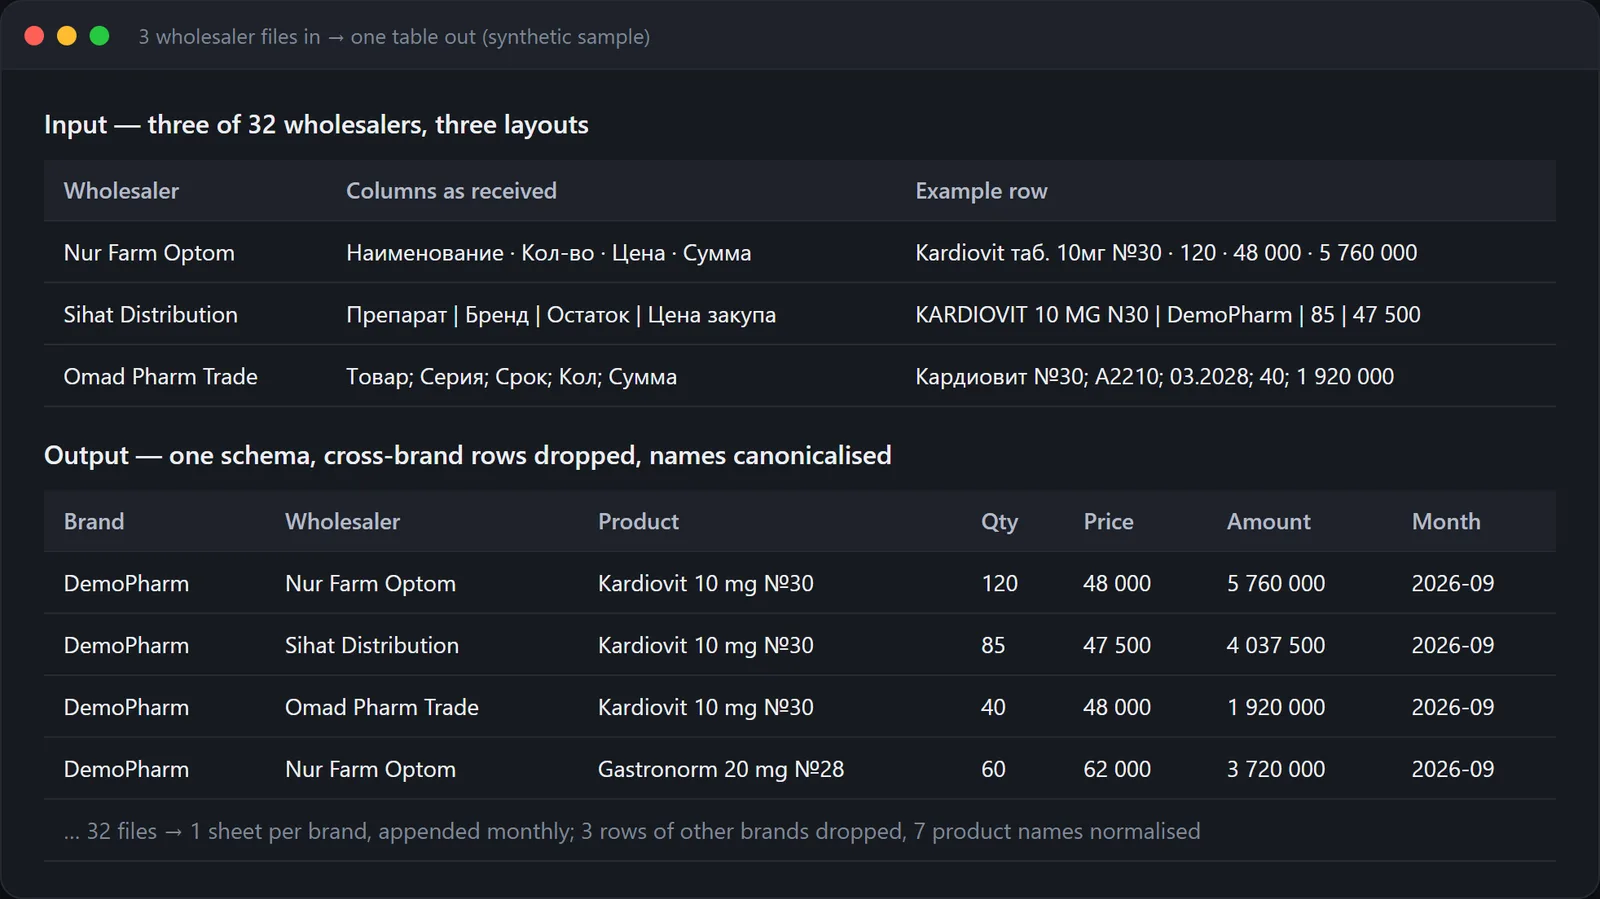
A pharmaceutical distributor receives monthly “остаток” (stock) and “реализация” (sales) files from 32 wholesalers. Each file has its own columns, its own product names, mixed brands and typos. One analyst spent days re-typing them into a master sheet; territory decisions waited for the result.
What I built
- A Telegram bot that accepts the files and routes them by mode (stock / sales) and brand. Each wholesaler has its own parser profile; rows belonging to other brands are dropped automatically; product names are normalised to a canonical list.
- Output is one tidy table —
Brand | Wholesaler | Product | Qty | Price | Amount | Month— per brand workspace, appended month by month. - A Power BI dashboard over the result: yearly view per region and product, with underperforming territories (“red zones”) surfaced directly for the field-force manager.
Result
Monthly consolidation went from days of manual work to the time it takes to forward 32 files; manual entry errors fell by an estimated 40 %; and the yearly dashboard changed how territories were assigned. This project is also where I learned that the data problem was upstream — which led to building LM-CRM.